Why Trading Is Not a Game Of Chance

Roulette is not like trading

I recently had a discussion with a friend of mine. He said to me: ‘Be honest now. Trading is no different from playing roulette, right? You either win or you lose. It is just a matter of chance’.

What he really meant to say was that investing is a game of chance in a way similar to poker, rolling a dice or roulette. But although I agree with my friend that uncertainty is an intrinsic part of trading (or investing for that matter), it doesn’t follow that trading is a game of chance in the same way that poker, rolling a dice and roulette is. Not because trading requires certain skills that might allow you to beat the odds – for the same could be said of poker. It has to do with mathematics, and probability theory in particular. The key distinction lies in mathematics and probability theory. Trading, unlike games of pure chance, is influenced by market dynamics, economic indicators, geopolitical events, and more. Analyzing these factors can provide investors with insights to make informed decisions.

Similarly, in the world of oil investment, understanding market trends, supply and demand dynamics, and geopolitical factors is crucial. Oil Profit can assist investors in this regard by providing valuable insights and tools. In a landscape where informed decisions can make all the difference, staying well-informed is essential for those looking to navigate the complex oil market effectively.

I want to show this through the notion of expected value. The expected value of a random variable is its long-term average, or the value the variable takes on average per execution of the respective random process. Very briefly: in the case of rolling a dice, the expected value is 3.5 ((1 +2 + 3+ 4 + 5 + 6)/6), because in the long run you will get an average of 3.5 eyes per throw.

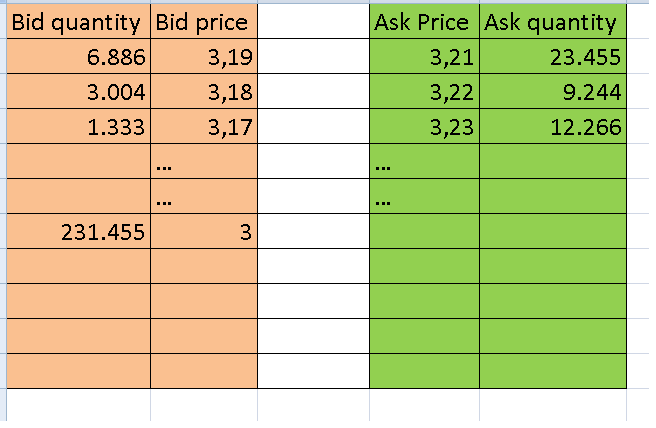
Certain requirements have to be met in order to to be able to calculate the expected value of a random variable. First of all, one should be able to fix the sample space of the process, or ‘the set of all possible results’ of the random process. In case of roulette, this set is unambiguous: number 1, 2,….., 38, because the ball can fall on one (and only one) of these numbers. Now, knowing this sample space plus the probability of the ball falling on any of these numbers plus the pay-offs of the ball falling on any of these numbers, you can determine whether you should take a bet or not. For example: let’s say you get 100$ per every 1$ you bet on the ball falling on number x. Then the expected value of betting 1$ on number x is (1/38 times 100$) + (38/38 times -1) = 1.63, meaning that in the long run you will make an average of 1.63$ per round per 1$ you bet when following this strategy. Since you will make money on average, you should pursue this strategy.

All well and good, but what happens when we take the market, instead of a roulette wheel, to be the random process we focus at? Let’s help ourselves a bit, and focus on a very restricted part of the market: the Brexit-debate. We can take the relevant possible results of the Brexit-debate as our sample space, the value of the DAX-index to be our pay-off, and the probability simply the probability of each possible result happening.

Now we come to face a couple of great difficulties.

Problem 1: sample space and the unknown unknowns
There appear to be only two possible results of the debate – Brexit, Bremain. Now we can define a random variable X such that any outcome of the random process is mapped to a real value. We choose the DAX-index to be our real value. You can for example say that in case of a Brexit, the value of the DAX-index will be 9000, and in case of a Bremain 10.400. Assuming that you can define a probability function on this variable, you can calculate the expected value of a trade.

But are these really the only two relevant results when it comes down to the Brexit-debate? No, it appears. There could be an explosion in a chemical factory in Germany that coincides with the Brexit or Bremain, but that significantly alters the course of the DAX-index. Maybe a politician will be murdered in case of a Bremain, and the DAX-index will collapse, even though the UK stays in the EU. There is an infinite list of possible events, not all of which can even be conceived: the black swan events, or the unknown unknowns. Since these results are by definition unknown, but nevertheless possible to happen and relevant for the DAX-index, your calculation will necessarily lack all relevant information, thereby giving an incomplete sample space. Such a thing can never be the case in roulette.

Problem 2: pay-offs
Furthermore, it is unclear what the DAX-index will do in case of either a Brexit or Bremain.This can be seen from the many different predictions made by various analysts. No-one knows exactly what the result of a Brexit or Bremain will be. Hence it is impossible to put a value on each of these results. So the second component of expected value, the pay-offs, is doubt-worthy too. This too can never be the case in roulette.

Problem 3: probability
But there is another, at least as stressing, issue. For expected value to be calculated, every event in the sample space must be assigned a probability.  While this is relatively non-controversial in the case of roulette (probability of either 1,2,…, 38 is 1/38), how do you come to know the probability of an event such as a Brexit, an interest rate hike, or any event that has never happened before?

It seems impossible to apply the so-called frequentist interpretation of probability, in which you conduct experiments and measure how often an event occurs relative to the total number of experiments. First of all because it is impossible to conduct experiments of this sort in the market. And second of all: even if you somehow manage to calculate how often an event occurred in the past and divide that by the total number of experiments done, you will necessarily get a 0% probability for events such as a Brexit, which have never occurred before. This seems absurd.

Using a subjectivist interpretation of probability will not help you much further. You can of course assign a probability to Brexit or Bremain by judging the available evidence, but the question is: how should you judge the available evidence given that you have no information about what happened in the past given the same set of available evidence, for this set of available evidence is surely to differ from any set in the past (Bayesian probability). One thing is for sure: certainly no Brexit has ever happened, under no set of available evidence, so again, the probability of a Brexit should be 0% (in light of any set of available evidence, in case you apply the rules of Bayesian statistics rightfully), which seems absurd.

This shows why probability theory and trading are no happy marriage, and why trading is not a game of chance like poker, rolling a dice or roulette.

How High-Frequency Trading Affects Human Traders

The machines have taken control

A lot has been written about high-frequency trading (HFT), especially since the 2010 flash crash, for which HFT is at least partially held responsible. HFT even caught Hilary Clinton’s eye, proposing a plan to tax cancelled trades, thereby hindering HFT’s business.

In my experience as a stock trader, who watches order books all day and follows the workings of HFT’s closely, you see many signs of the subtle workings of HFT’s. We, human traders, often complain about these ‘machines’; especially the more senior traders, who grew up in a time in which trading was something that happened between humans, sometimes get frustrated by the seemingly random price movements caused by the machines.

I want to give you some clues about how HFT has changed the job of a human trader. This might also shed some light on why today there are fewer and fewer human traders. Today, if you buy quite a large sum of stocks, let’s say 50.000 stocks ArcelorMittal or 10.000 stocks Shell, 9 in 10 times you will experience a sudden drop in the stock’s price (+- 1%). That’s right:  a drop, not an increase. This didn’t use to happen a couple of years ago, but from a HFT perspective, the price drop is easily explained.

For suppose you aggressively buy 50.000 stocks, meaning that you buy 50.000 stocks on offer. This implies that a certain HFT is short 50.000 stocks. Assuming the HFT wants to have a net position of zero, this means that it has to buy back 50.000 shares. But it doesn’t want to make a loss: it wants to buy back the shares at a lower price than they were sold for. Being a market maker, hence controlling the order book and therefore the share’s price, the HFT removes successive levels of best bid. Now it waits for other HFT’s to fill up the order book, until it detects an offer of 50.000 stocks at a price lower than the price the HFT sold the stocks for. Now the HFT buys back the shares, hence making a profit. For the human trader, who is on the other side of the trade, this means that he starts his trade with a loss.

Another way in which trading has changed, is in the extremity of price movements. A couple of years ago, human traders would prevent certain extreme price movements from happening – by buying when they deemed a stock oversold, and selling when it was overbought. Machines don’t follow this logic. They go with the flow, and if the flow is selling, they are selling too. Hence you see price movements that either go up or down continuously, without any correction. Furthermore, price movements get accelerated due to the high speed of HFT. This explains the increased volatility; another side effect of HFT.

Another issue that can be extremely frustrating to a trader, is that your orders do change the price of a stock – even if they are not executed. Let’s say you want to sell x number of stocks. If x is larger than a certain size, HFT’s will detect your order as being real, and use it build their order books around. Meaning: if you are best offer for 5.000 stocks at 4.241, a HFT will put an offer in front of yours at 4.240. Before you can blink your eyes, another HFT will lay down an offer at 4.239. Now the next person buying will pay 4.239 instead of your 4.241. Hence, HFT’s prevent your order from being executed, and cause the price of a stock to go down. You can of course sell your stocks at market, hence paying the spread, but always doing so significantly decreases your profits. There is of course nothing wrong with HFT’s offering stocks at a price lower than yours; it is that, when you put down an order, regardless of the price, the dynamics of the price will change in such way that your order will not be executed – no matter whether you are buying or selling. This process is also described in Flash Boys, Micheal Lewis’ book on HFT.

Adding up all such changes, you can imagine why the traditional way of trading has become increasingly difficult for humans, possibly explaining why relatively fewer and fewer humans trade.

Why 30 Years of History Shows the US Stock Market is Going Down

I hate preachers of doom and destruction. I think most of them just want some attention, and instilling fear into people’s minds works better in doing so than painting a rosy future. But something quite concerning recently caught my attention, and – even though you might have already noticed it – I want to point it out.

Governments worldwide decreased interest rates in response to the 2007-2008 financial crisis. The idea was that by decreasing the interest rate, it becomes cheaper for banks (hence people) to borrow, hence increasing the amount of money available to spend, thereby increasing the spending power of the economy.

As a matter of fact, the USA has had such a ‘stimulating’ economic policy for over 30 years to date. If you look at the United States Fed Funds rate, the main determinant of interest rates in the USA, you can clearly detect a down-trend since 1980:

This policy has shown to be effective, at least in recent years. The unemployment rate in the USA has decreased from 10% in 2010 to around 5% in 2016.   This might be a case of post hoc ergo procter hoc, but it seems hard to believe that the US stimulating policy has had zero positive impact on the economy. Furthermore, if you take the S&P 500 index to be the benchmark of the US stock market, you see that it has tripled since the bottom of the financial crisis in 2009; from 700 to 2100. In fact: the S&P 500 index has been in a clear up-trend over the course of the last 30 years:

You see the relationship? What we see here is a clear negative correlation between the Fed Funds rate and the S&P 500 index. The first question you should of course ask yourself when talking about correlations is: are the increasing stock prices a result of the decreasing interest rate, or is the deceasing interest rate a result of the increasing stock prices? The last relation seems to make no sense, for if anything, a higher stock market might be a symptom of a market overheating, hence encouraging restrictive instead of stimulating economic policy. So the relation seems to hold the other way: a lower Fed Funds rate causes the market to increase, which from a perspective of common sense, seems to make sense: lower interest rates means more money to spend, means more money to spend on stocks, means higher stock prices.

But the question that nowadays is very relevant is: what will happen to the stock market when the US government decreases its stimulatory policy? That is: what if the down-trend in the Fed funds rate stops? Currently the Fed has an overnight interest rate between 0.25%-0.50%, which is already higher than the 0.00% it has had for over 6 years. Now it is considering to increase it.  It seems fair to say that we can not go lower than 0.00% (although this has been done in Europe, but following up on this policy will lead to all sorts problem for the banking sector, not to mention a slippery slope). Hence the Fed funds rate can only go up. Given the negative correlation with the S&P 500 index, which is based on 30 years of economic data, there seems only one way for the US market to go, and it is not up.

How Hedge Funds (Ab)use Human Psychology to Increase Profits

I am a professional trader. That means that I buy and sell stocks for a living. And since I am a so-called ‘day trader’, the buying and selling have to happen within one day. This means that I am extremely short term focused: I try to anticipate where a stock will be at within five minutes or an hour from now, instead of five years.

As a trader, you obviously want to buy a stock as cheaply as possible, and to sell it for as much as possible. But if you think that studying financial documents and finding out what companies appear undervalued will help you in trading, you are only very partially right. Much more important, I dare to say, is understanding and using human psychology. And when you zoom in from years to days to minutes to seconds, the more important human psychology becomes.

Let me give you an example of how big hedge funds (which I certainly do not belong to) seem to use human psychology to increase their profits. I say ‘seem’, because I cannot prove this. If only because I don’t know who is buying or selling at any moment in time (but I can see what hedge funds own what stocks, and when they bought/sold). But given my everyday experience with movements in price, and applying common sense, I am reasonably certain.

Suppose there is a stock trading a little above $3. Last time it went to $3, it recovered to $10 within three years, and to $55 within six. Last year the stock was priced at $10, and ten years ago it was priced at $55. Therefore it looks cheap (irrespective of the fundamentals of the company). Hedge funds assume that many people are willing to buy at this price. Assume that many people do. Now hedge funds, with practically unlimited financial resources, come in. They create a level of resistance in the price. They do so by offering a practically infinite amount of stocks at best offer (being the lowest price at which people are willing to sell the stock: $3,21 in Table 1). By doing this, they create an upper limit in the price, since before the price can increase, all the stocks at best offer have to be bought, which is practically impossible given that the hedge funds have so much selling power compared to the rest.

order_book_2

Table 1: order book of stock


Now, since the price cannot go up, it will go down at a certain point. Be it because of algorithms trying to maintain certain correlations with indices, or because the hedge funds actively sell stocks at successive levels of best bid (the highest price at which people are willing to buy the stock: 3,19, 3,18 etc. in Table 1). Through doing this, the price will decrease to let’s say $3: a ‘psychological level’ in the stock. Many of the people who bought the stock thought it would never go under $3. Now people get anxious. Then the hedge funds give the final blow, and push through the $3. Now people start to panic – “maybe the stock will go to $2!”. They start selling the stock ‘at market’, meaning regardless of the price.

arcelor_mittal2

Figure 1: Arcelor Mittal stock


Now the hedge funds can buy the stock for less than $3 from the people who are selling at market, either to go ‘long’ (to have stocks), or to cover their shorts. See Figure 1 for a graphical display of this chain of events. Combine this with the fact that high frequency traders (acting on behalf of hedge funds) can change the order book in less than the blink of an eye (thereby changing the quantities on bid and offer), they can very quickly change the price of a stock. The price of a stock is after all nothing more than the price paid for the stock in the last transaction: so if you very quickly pull away successive levels of best bid, the next person selling at market will do so at a (much) lower price, meaning that the hedge funds buy at a lower price than the general public.

Now the hedge funds have bought their stocks, they pull back, and let the market do the rest.